Global Topology
Launch Map
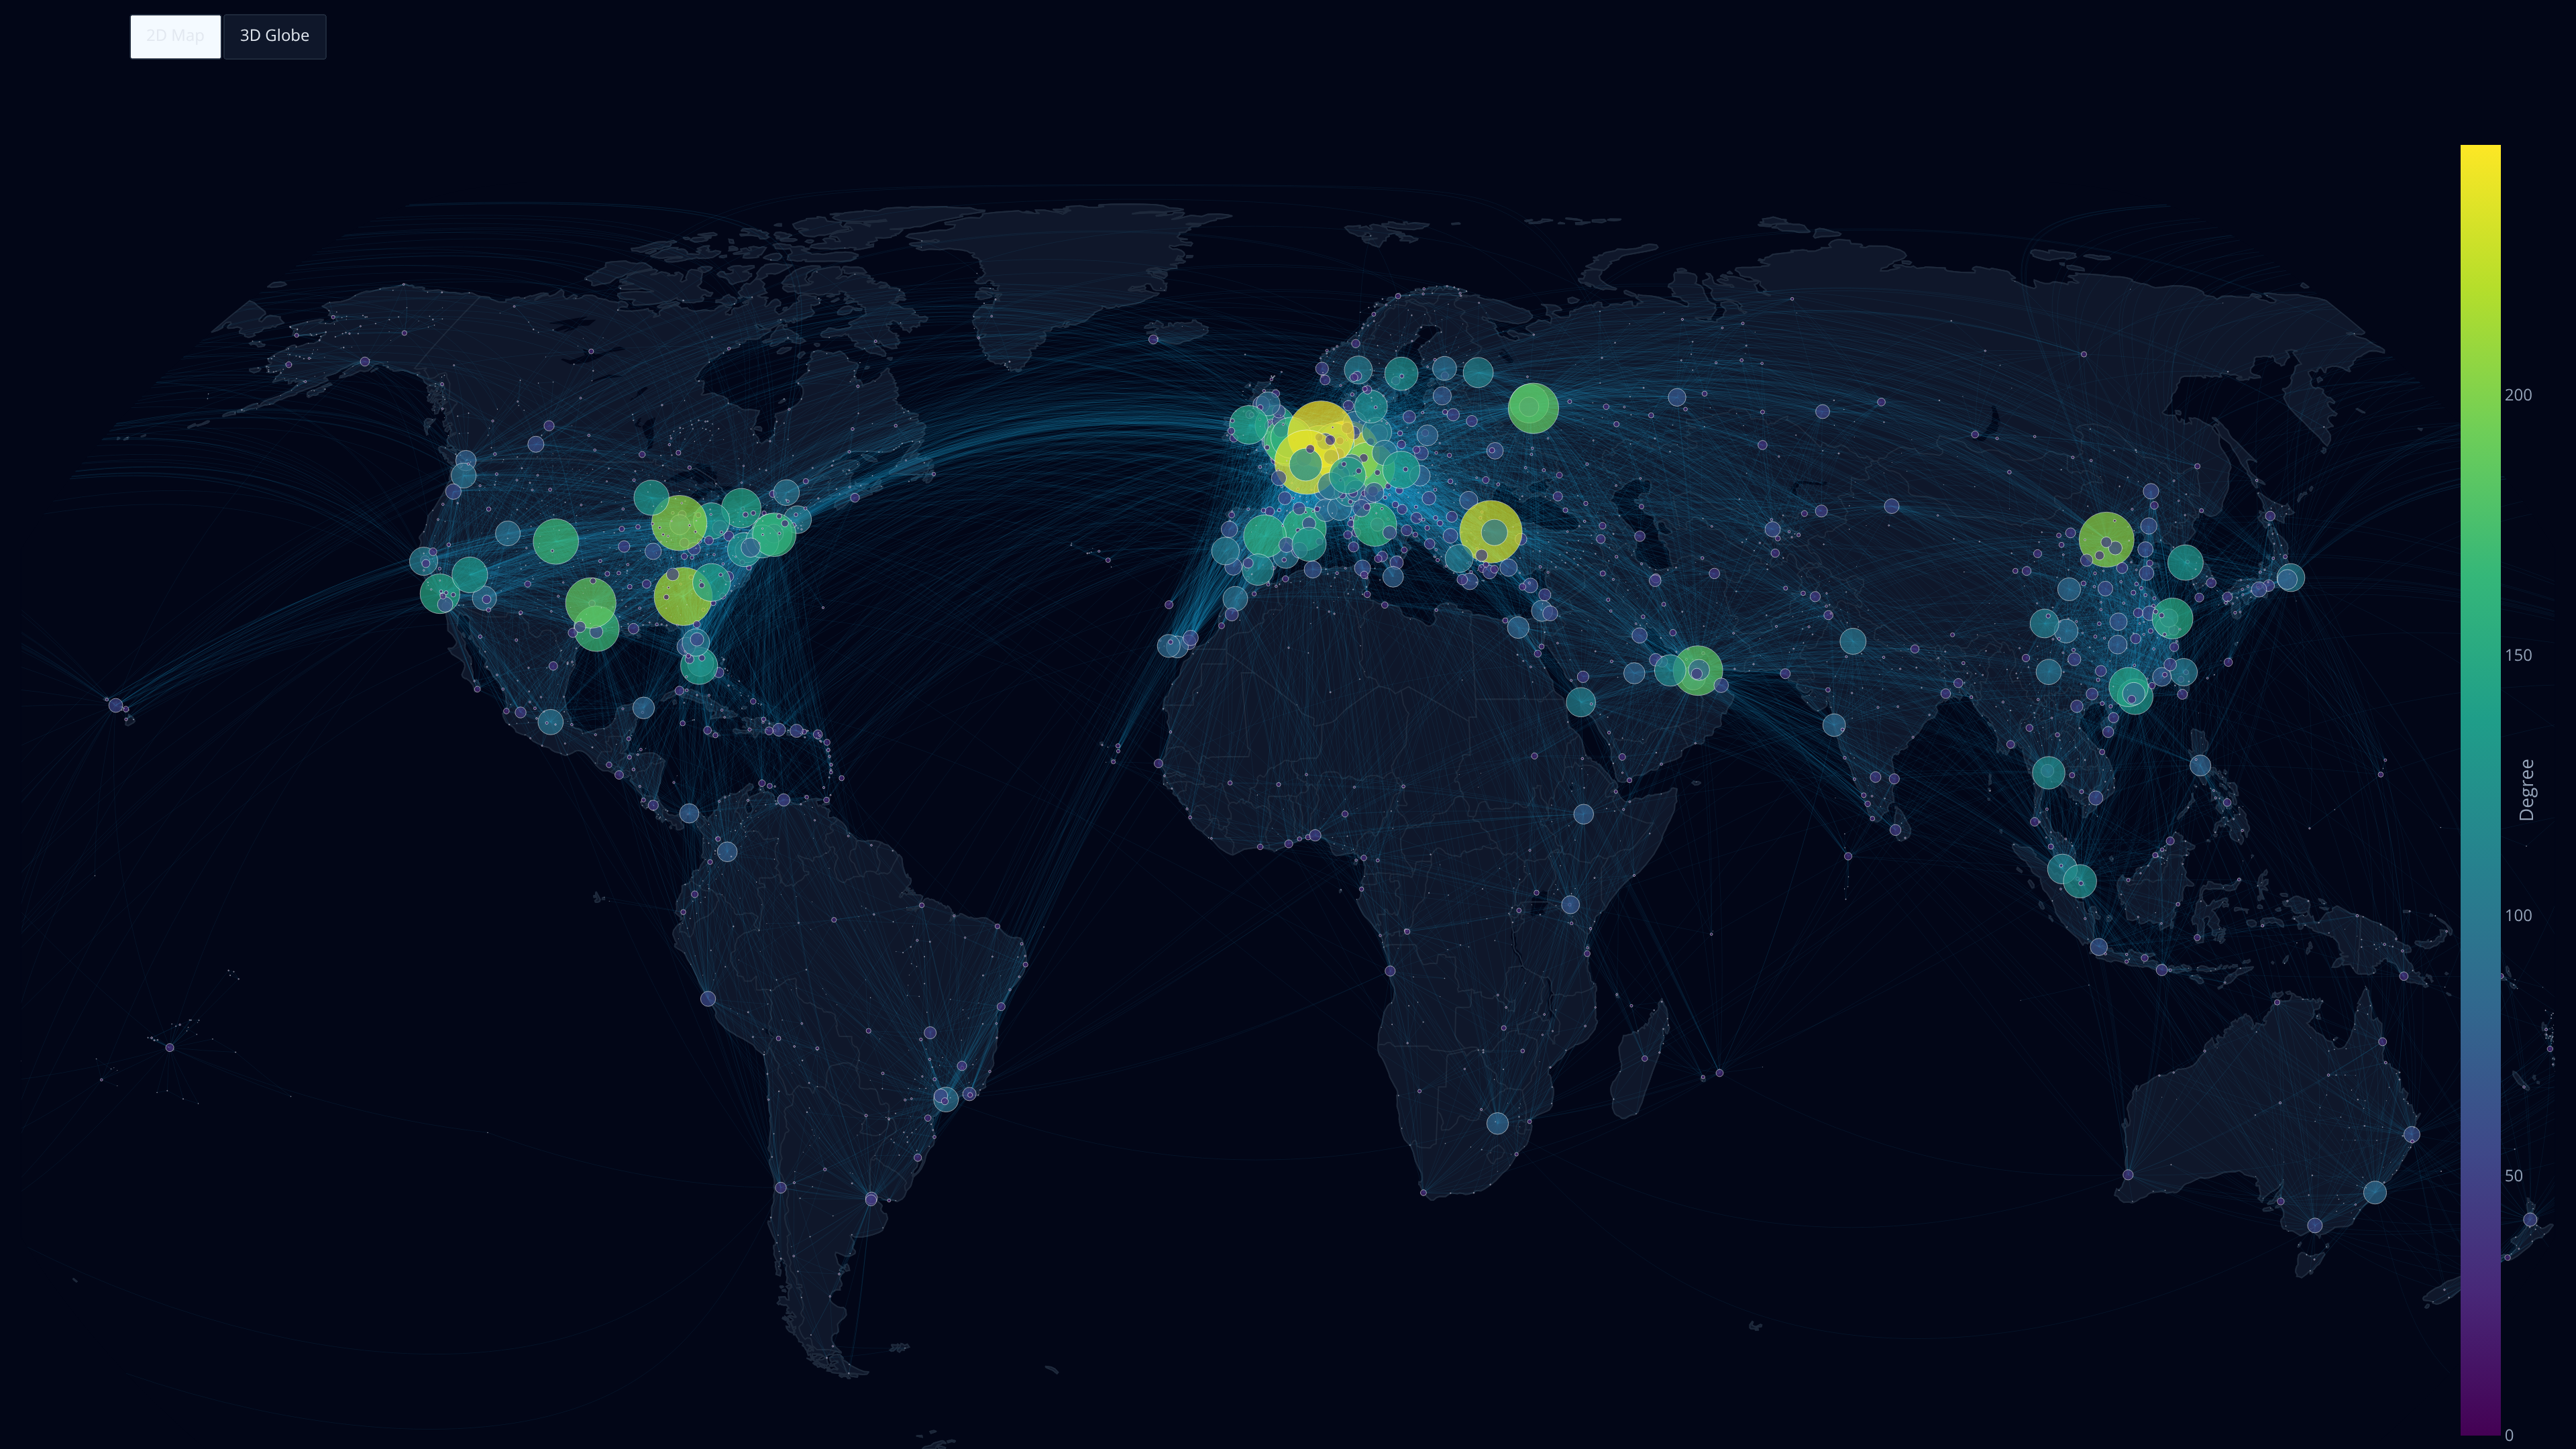
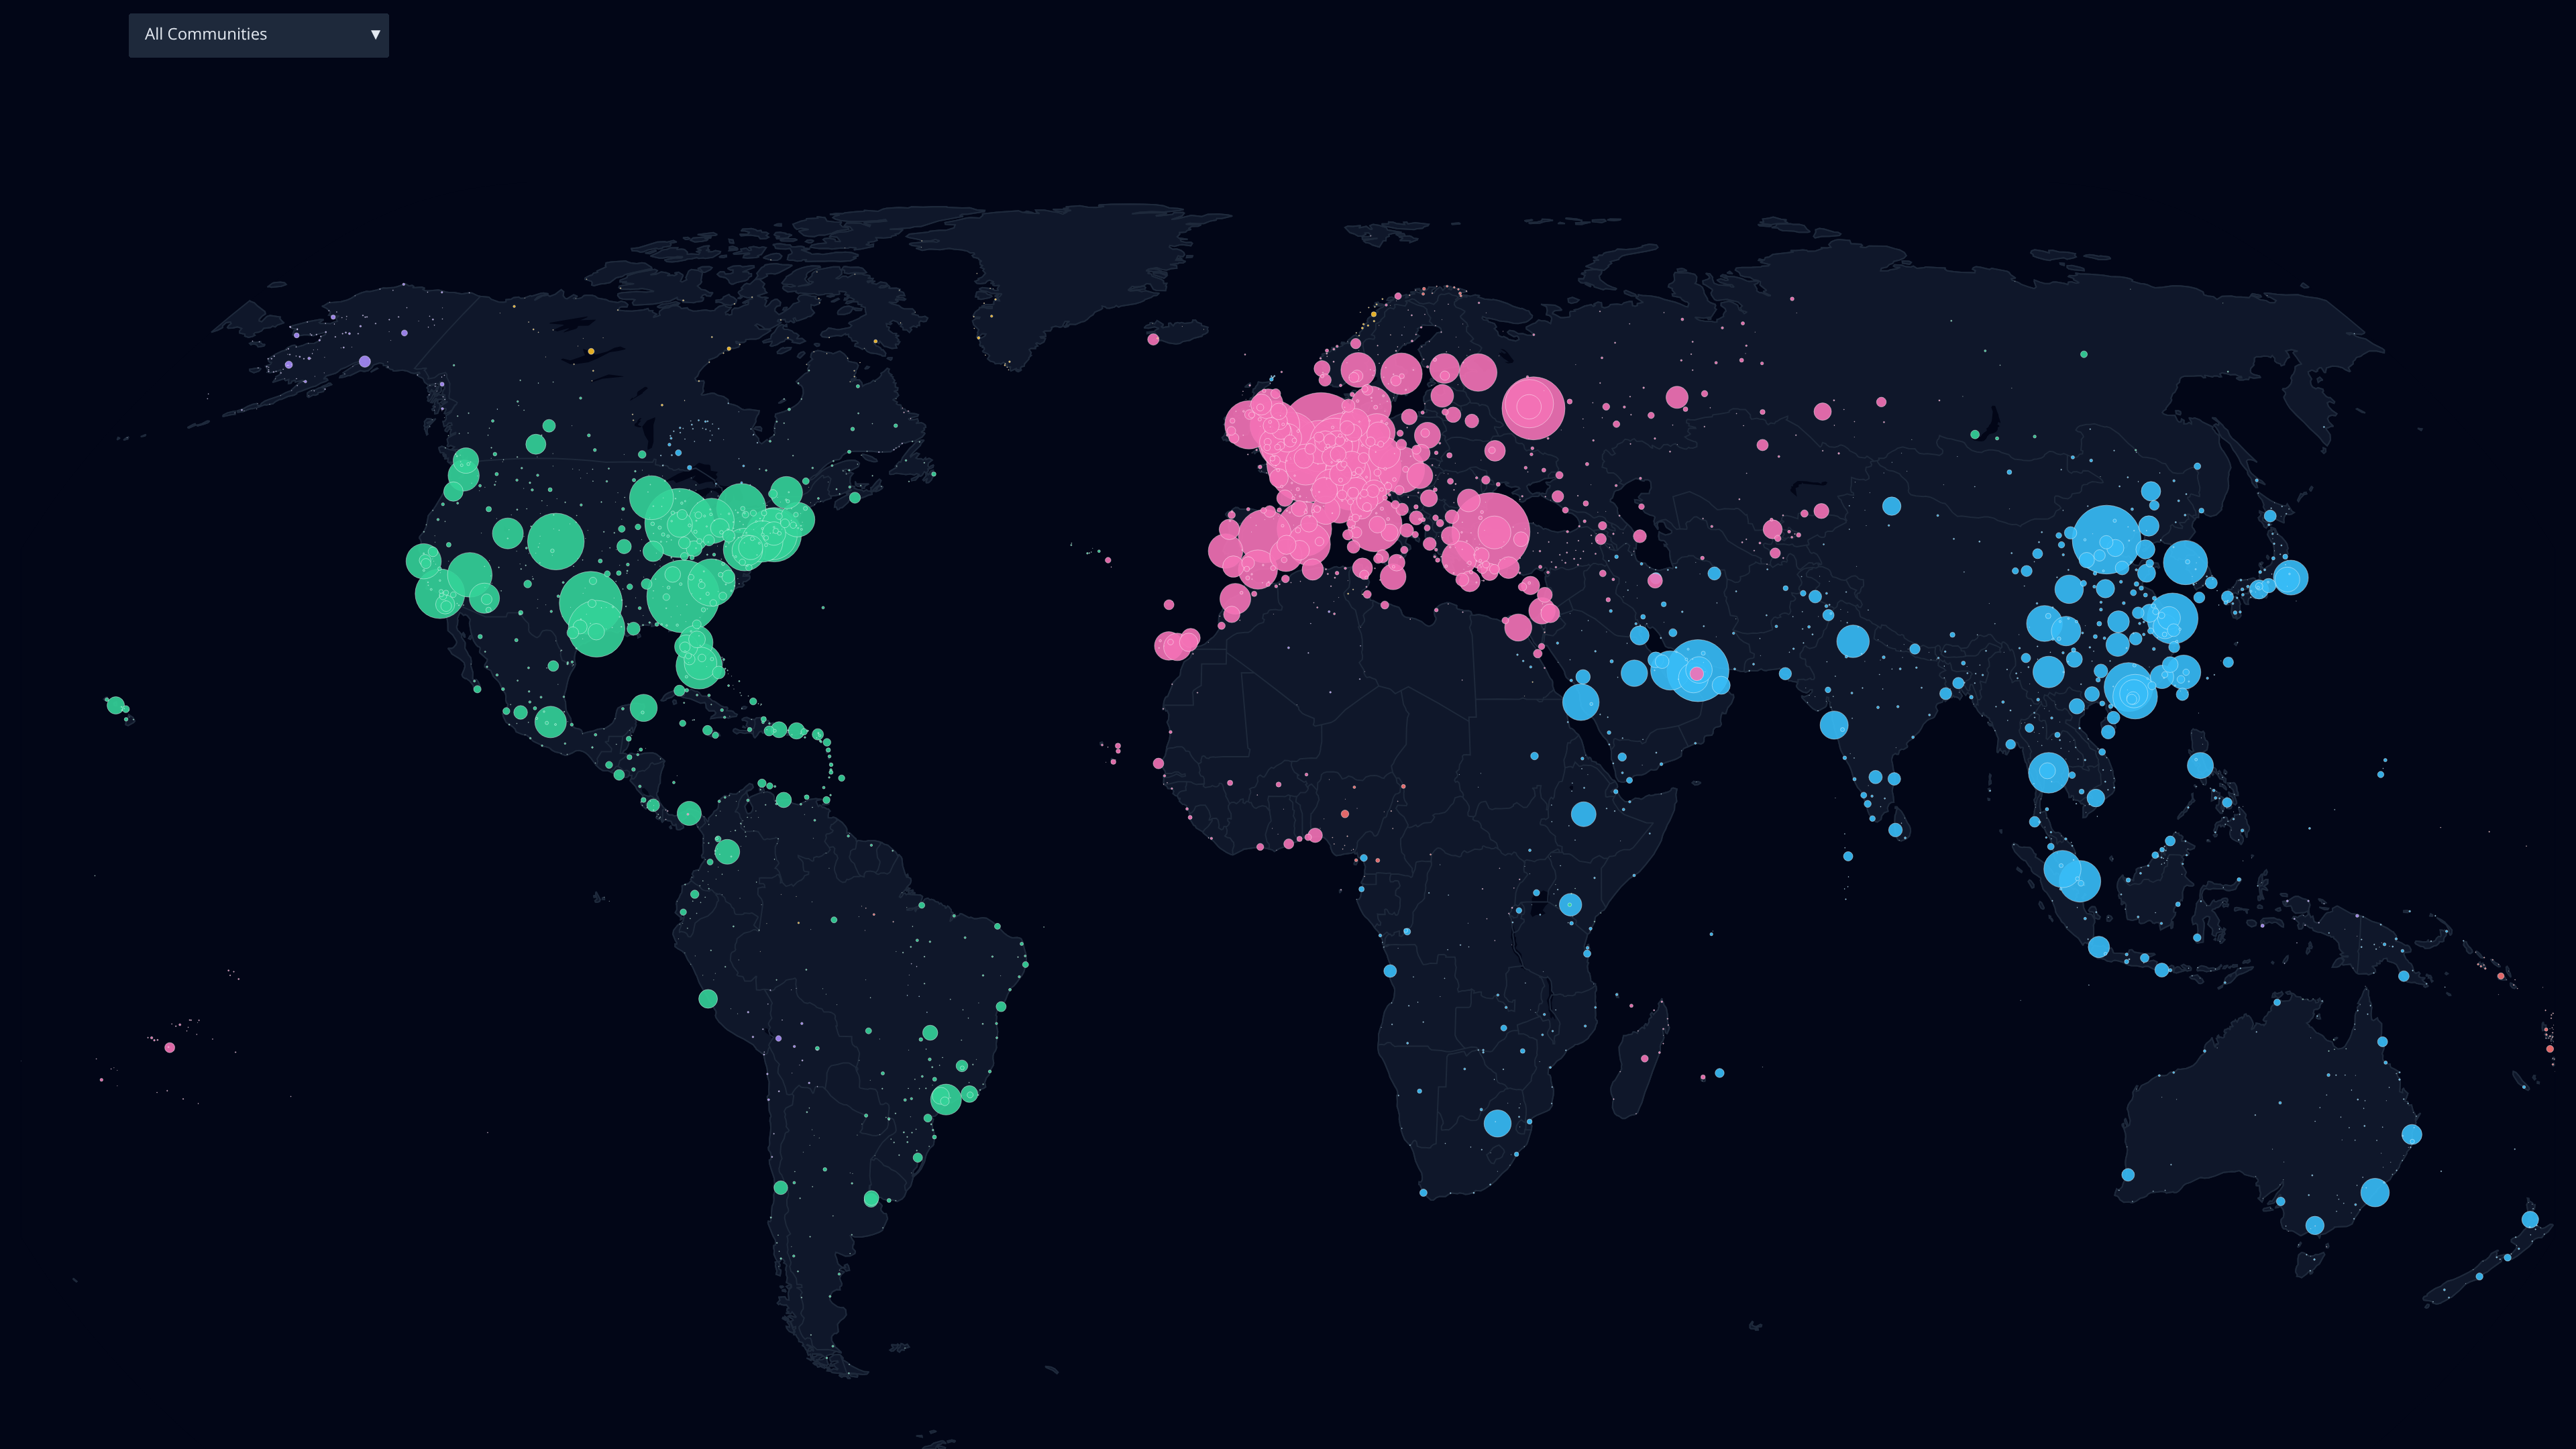
Complete 2D and 3D visualization of the network. Each node represents an airport and each edge represents an active commercial route.
Plotly
Graph Theory
Interactive